
Reports and analytics
- For
- Facility managers
- Where
- Web app
- Time to read
- 5 minutes
The Analytics page turns your inspections and tickets into reports. Some are for you, to see where sites are slipping and how fast problems get fixed. One is built to show your customer the work you delivered.
Click Analytics in the left-hand menu. Admins see every site. Supervisors see the sites they look after.
Step by step
1Pick a report and what it covers
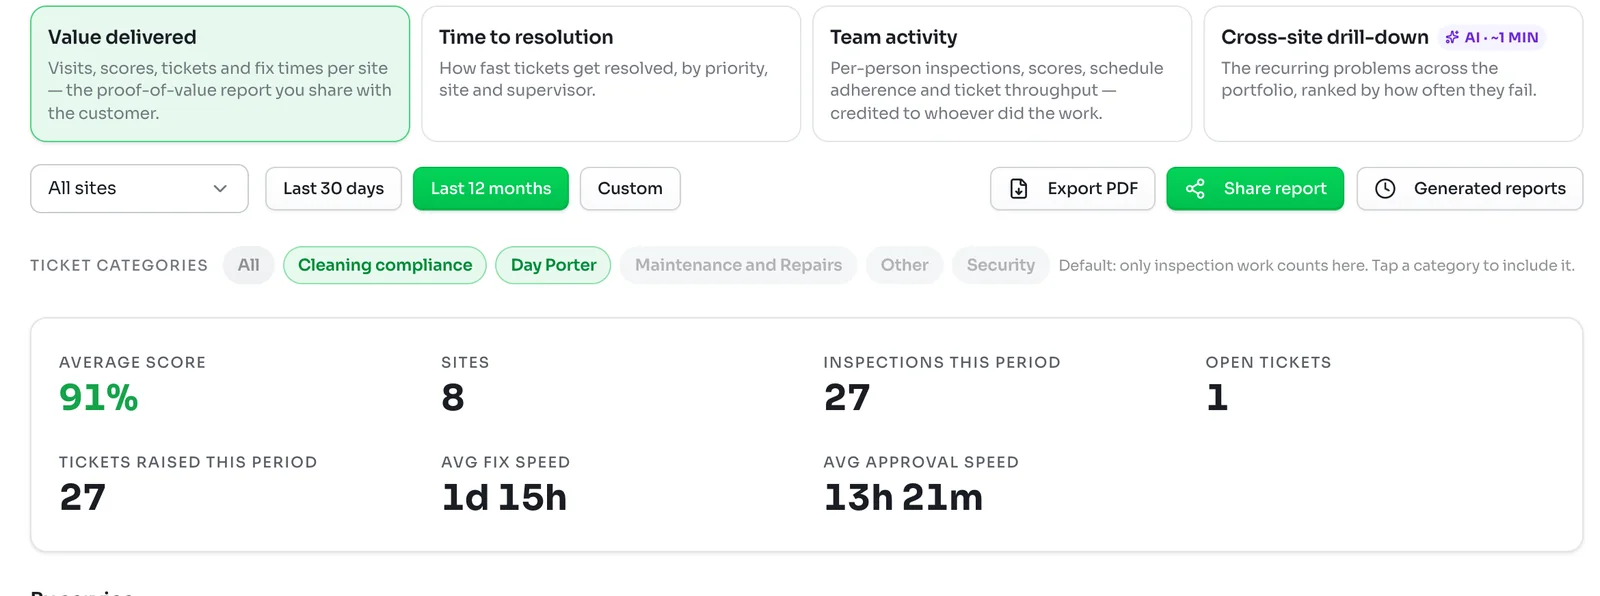
The four cards at the top are the reports. Click one to switch.
Below them, the first menu sets what the report covers: All sites, A customer, A property or A single site. Next to it, pick Last 30 days, Last 12 months or Custom for your own dates.
The Ticket categories chips decide which tickets count. By default only inspection work counts, such as cleaning compliance. Click a chip like Maintenance and Repairs to include it, or All for everything.
2Value delivered
This is the report you show your customer. The top line gives the average score, the number of sites and inspections, open tickets, tickets raised and how fast fixes happen. By service splits it by the type of work, such as cleaning compliance and day porter.
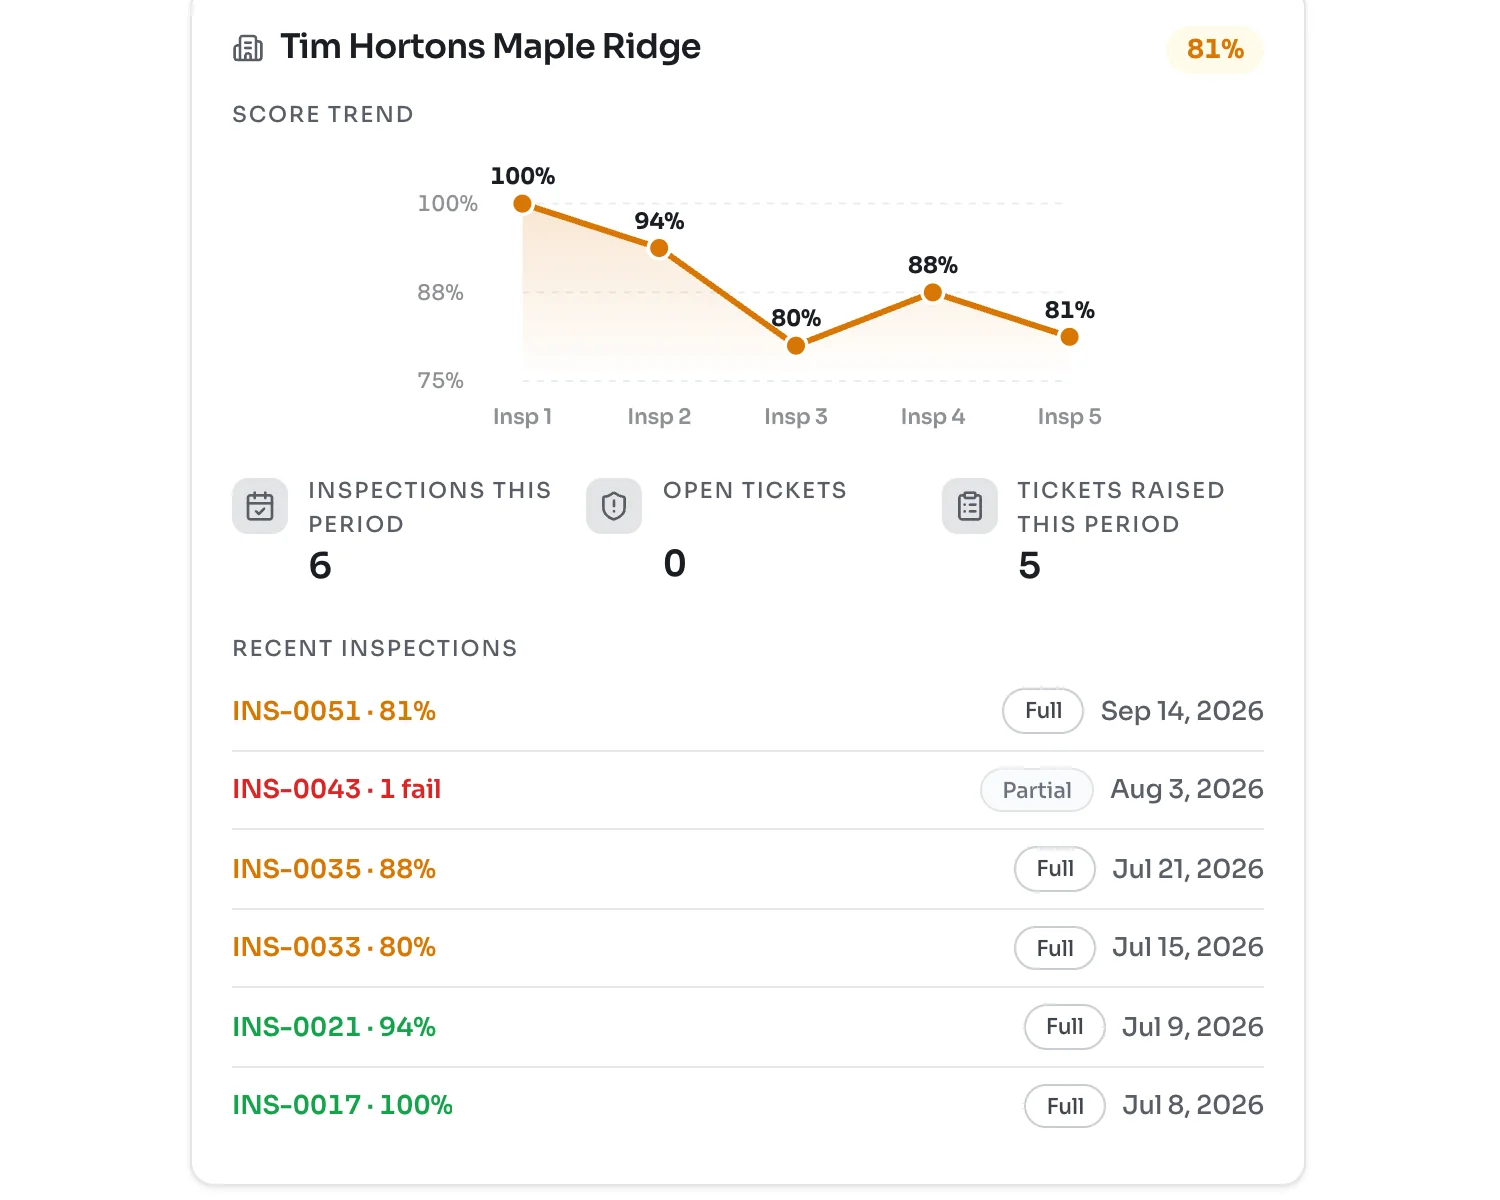
Below that, each site gets a card with its score trend across recent inspections, its counts for the period and its recent inspections. Hover or tap a number to see the records behind it, and click an inspection to open it.
Scores follow the same colours as everywhere else: 90% and up is Excellent, 80 to 89% is Watch and below 80% needs attention.
3Time to resolution
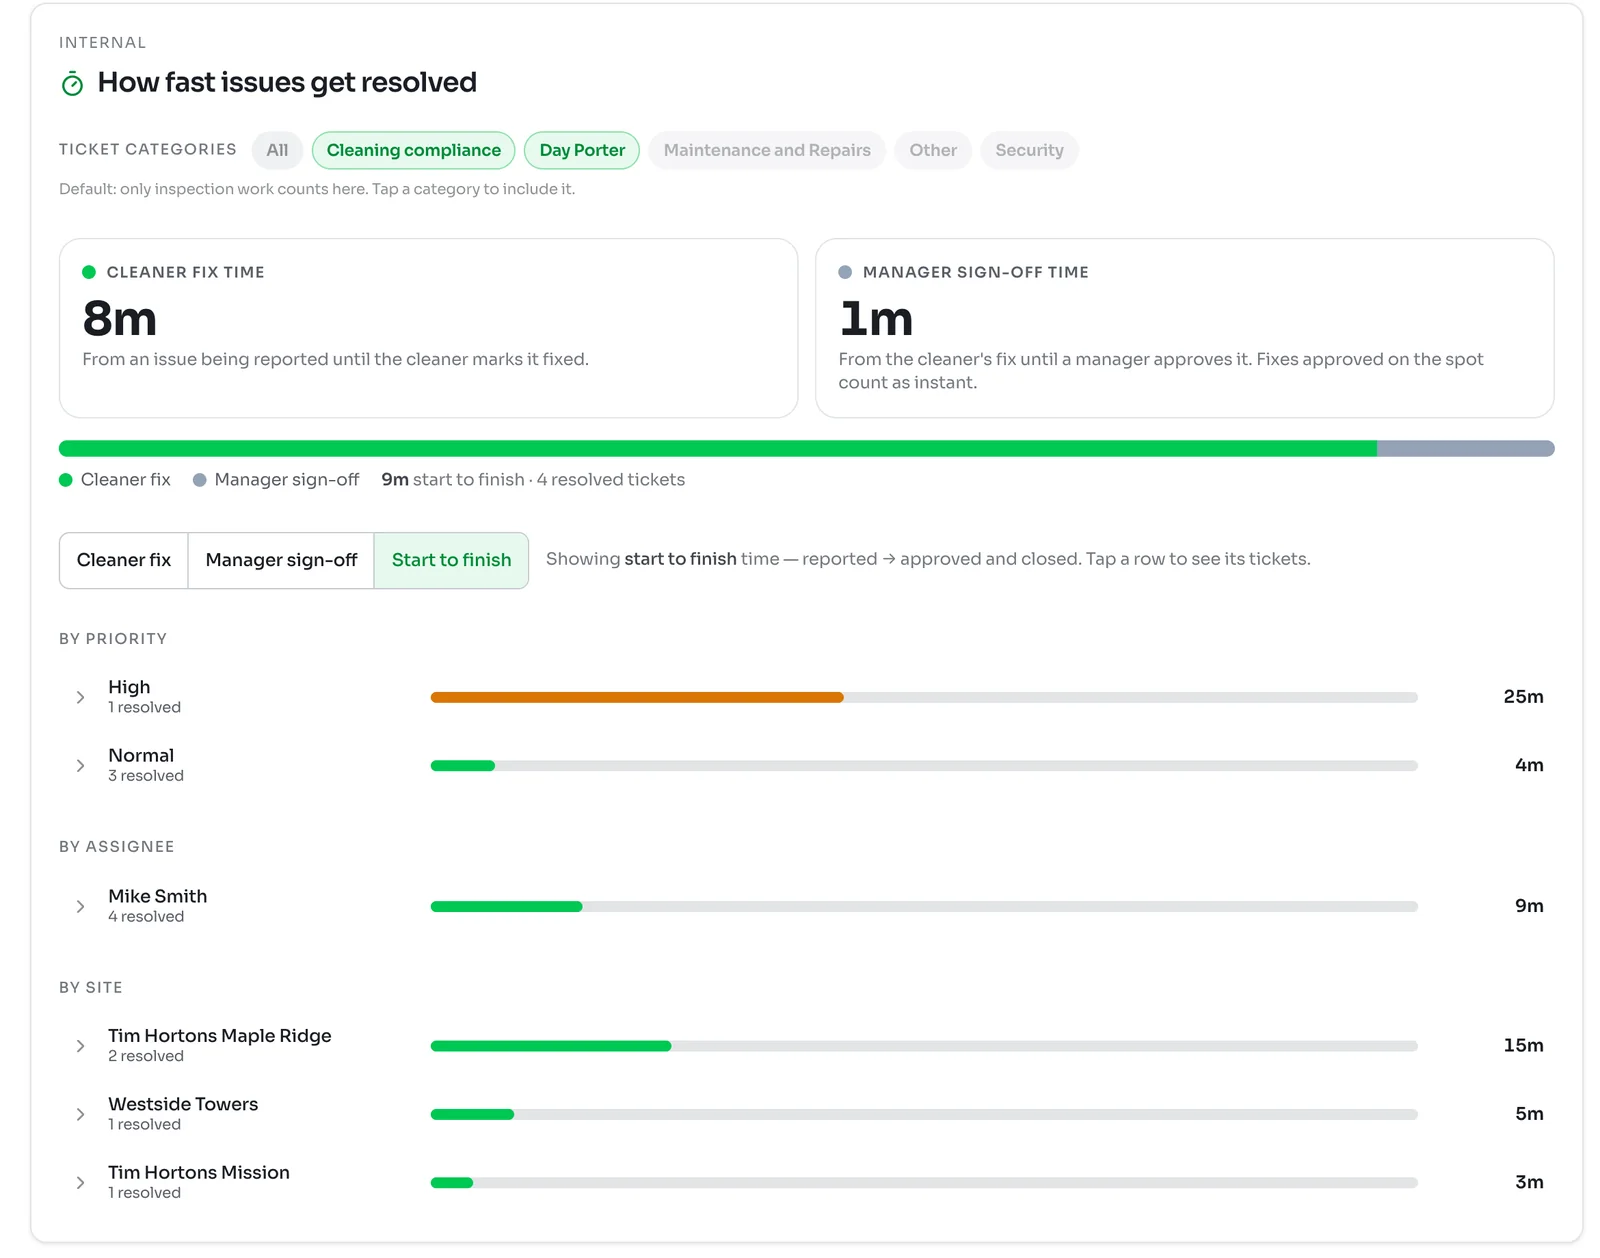
This internal report shows how fast problems get fixed. It splits the time in two:
- Cleaner fix time runs from the issue being reported until the cleaner marks it fixed.
- Manager sign-off time runs from the cleaner's fix until a manager approves it. Fixes approved on the spot count as instant.
Choose Cleaner fix, Manager sign-off or Start to finish to break the time down by priority, by assignee and by site. Click a row to see its tickets.
4Team activity
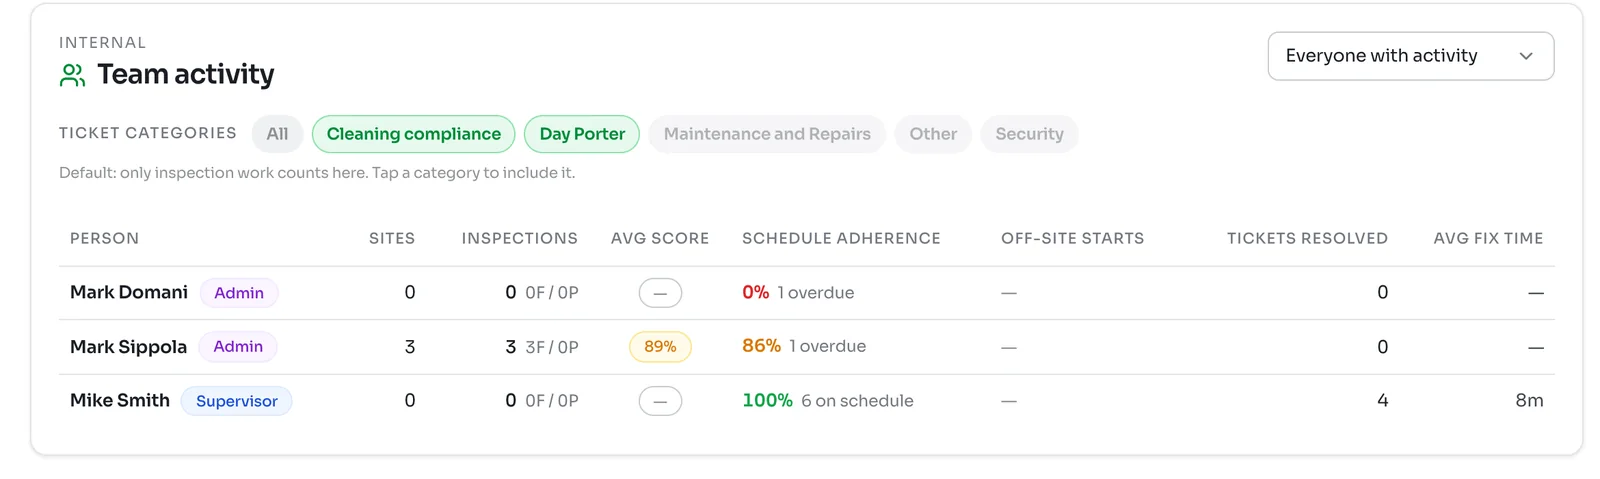
This internal report gives one row per person: sites, inspections, average score, schedule adherence, off-site starts, tickets resolved and average fix time. Work is credited to whoever did it.
Schedule adherence is the share of the sites assigned to them that are on their inspection schedule, with a count of overdue ones. Rows with the lowest adherence come first. Use the menu at the top right to show Everyone with activity, Supervisors only or people Assigned to sites.
5Cross-site drill-down
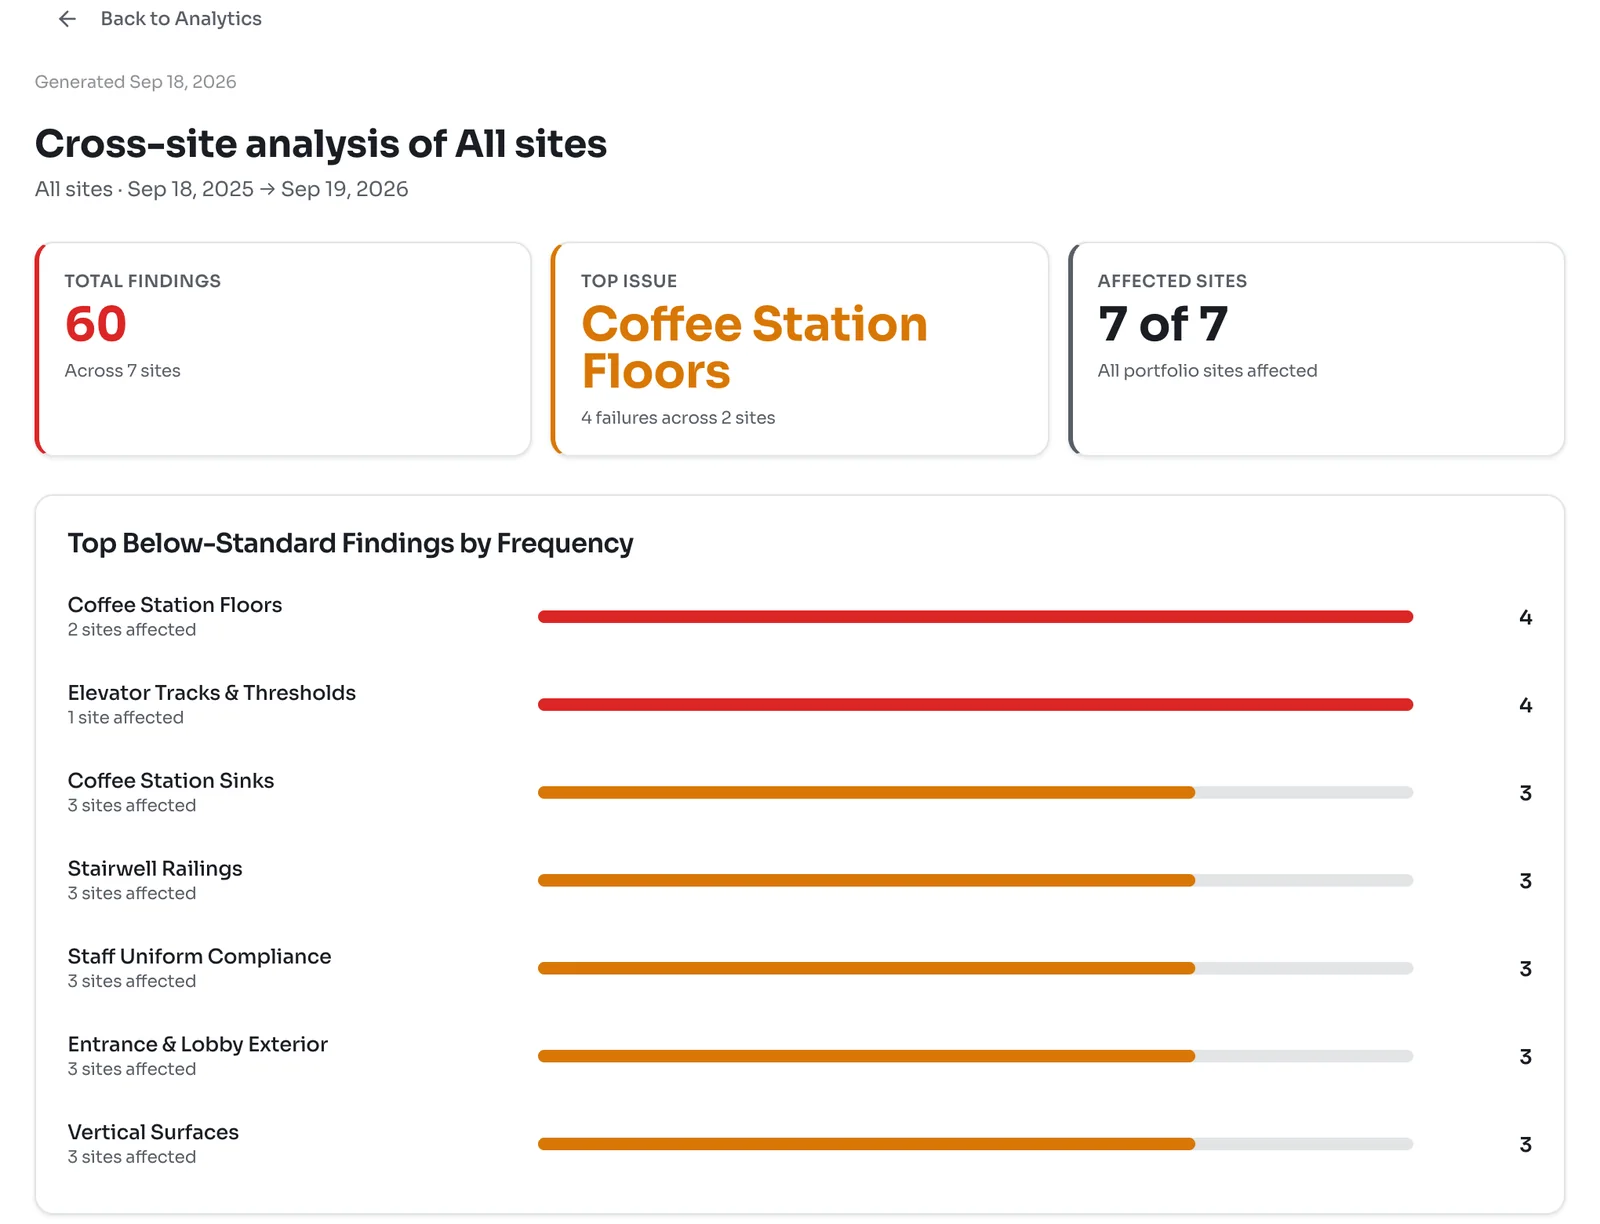
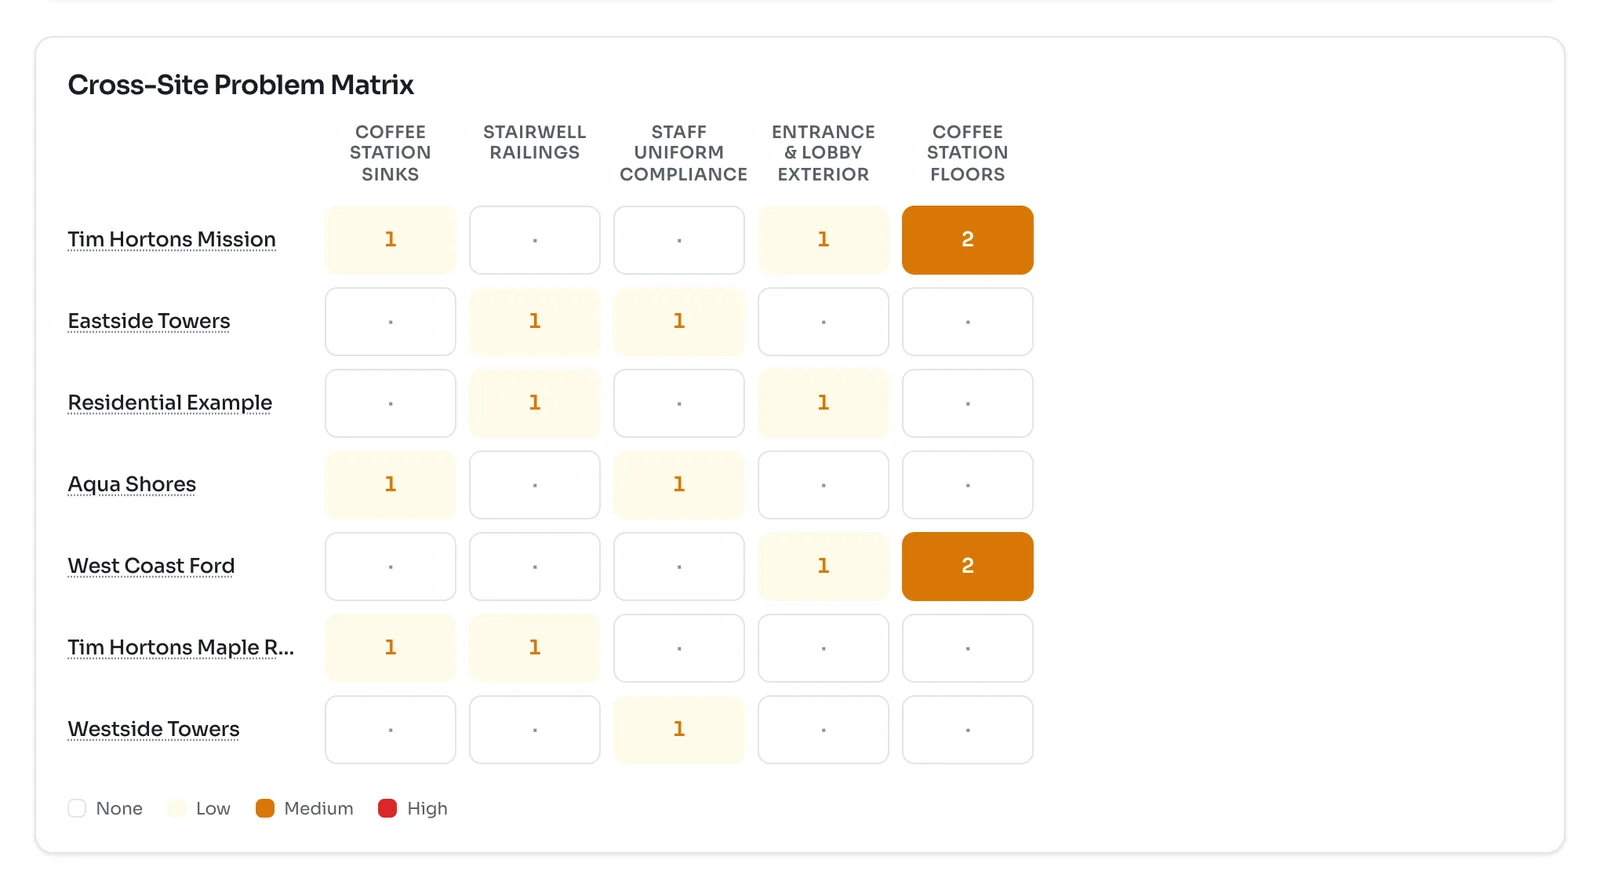
This report uses AI to find the problems that keep coming back across your sites. Pick at least two sites and a period, then click Generate report. It takes about a minute.
The report ranks the tasks that fail most, shows a matrix of which sites fail which tasks and writes up what it found and where to focus.
Every report you generate is saved. Click Generated reports to open an earlier one. These reports are for your team and open only for signed-in members.
Printing a report
Click Export PDF on any report. It prints with the report name, what it covers and the dates at the top, and the controls left out. Choose Save as PDF in your browser's print window.
Sharing with your customer
The Value delivered report also has Share report, which makes a link your customer can open without signing in. Sharing reports with your customer explains how.